-eternitus
Adjusted Case Schiller Housing Data
After reading an article from a fellow Seeking Alpha contributor with Case-Schiller housing appreciation data for the 1990s and for the ‘00s thru May of this year, I began to wonder how the data would look if:
It was expressed on an annualized return basis
It was adjusted for the “housing expense ratio” AKA Taxes & Mortgage Interest
I crunched some numbers and came up with the tables below, which depict the gross and real (after the expense ratio) return from housing within 17 major markets/metro areas, on a total and annualized basis for the 1990s and the for the period of January 2000 thru March 2007. The tables were created based on the following assumptions:
A $300,000.00 home was purchased at the beginning of the period.
The home was financed with a 6.5% APR fixed rate mortgage, and an 80% LTV/$60k down payment.
The home owner has a top marginal rate of 28% (Obviously, tax rates fluctuated over this time period, but this keeps things simple).
Property taxes were levied at 2% of purchased over the duration of the entire time period (not likely, but I did it this way for simplicity’s sake).
I didn’t factor in maintenance due to the many factors that impact those costs: condo vs. townhouse vs. stand alone dwelling, age of the home, etc.
It’s worth noting, that in order to be truly accurate, some sort of “baseline housing cost” would need to be factored into the calculations, since you have to pay for housing whether you rent or buy. In order to determine one’s true return from housing the “baseline housing cost” would need to be subtracted from the housing expense ratio, in order to determine the real net return. However, this is hard to do on an aggregate basis (OER is highly flawed) as rental costs are really determined by an individual’s taste and living situation more than anything else.
First, let’s look at the table for the 1990s:
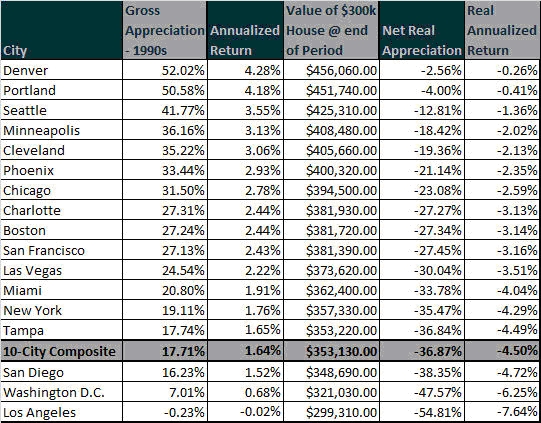
Now, you can’t discuss 1990s housing prices without first acknowledging that during the early 90s, we were dealing with the tail end of the S & L crisis, there was a recession and declines in residential real estate values in many cities. At the same time, the later part of the ‘90s was a time period of tremendous economic growth, low unemployment, low inflation, etc, and for many individuals the 90s economy was superior to the recent real estate boom years.
Looking at the data itself, the first thing that jumps out is that despite the fact that homes in nearly all markets showed “some” level of gross appreciation, they were all negative for the 1990s when you factor in taxes and interest expense. You would almost think that even with the economic difficulties of the early 90s factored in, that you’d see very strong appreciation overall as the markets recovered and people had more disposable income during the boom years of the mid to late 90s.
Now, let’s look at the housing data for the ‘00s
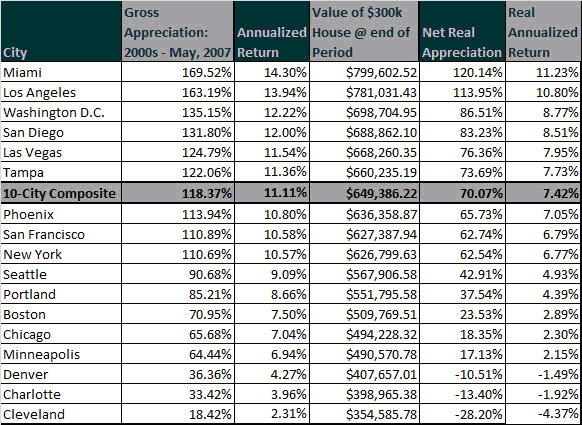
Of course, we all know the story here, housing boom, rapid appreciation, cheap money, foreclosures and the subsequent mortgage crisis. What was immediately interesting to me is how much some high flying markets came down to the earth once the expense ratio was factored in and how the boom was really concentrated in a small number of markets with other markets merely being along for the ride. Some key things to take away from the two charts:
Cheap money, speculation and relaxed lending standards can potentially drive housing appreciation more than rising incomes and a strong economy.
Home owners are due for a major expectation reset over the coming years; I wonder if a major reset in expectations might serve to depress prices even further.
Many home owners who bought at the beginning of the 90s and sold at the end, may have felt they turned a profit (typical anecdote I bought for $300k and sold for $450k), but home owners simply can’t ignore their interest and taxation costs when determining their returns.
Home Owners should probably think of their homes more as purchased assets with “potential” investment value, as opposed to investments in general; especially as the Real Estate market continues to correct and we return to a pre-housing boom environment, both in terms of prices and appreciation. Financing costs can be the difference between your house “performing like an investment” or “performing like pure consumption”. Subprime borrowers probably didn’t do too well net return wise, even in markets like LA and Miami.
Home owners who used zero money down, negative amortization and interest only mortgages, particularly those who purchased in the last 2-3 years, may go for well over a decade before seeing any return at all.
Your local housing market can go through a boom period and still lag the equities market, only four of the 17 markets beat the S & P 500’s 8.5% return over the time period.
Home owners often purchase homes based on expected returns which are based on price appreciation, when they should really be considering their return after taxes and interest. Price appreciation measures the cost of waiting to buy a home, not your actual return.
As we move beyond the mortgage/real estate crisis, one of the more interesting potential changes could be to homeowner psychology, as the mood shifts from “real estate as a must have, can’t lose” to one where home buying is properly viewed as (at best) a “consumption-investment hybrid”. Furthermore, due to the various factors inflating housing prices, it’s quite likely that many home owners won’t see returns on a real basis for an extended period of time. Housing may become reminiscent of tech stocks where few of tech’s former high-fliers (even if they’re quite profitable today) have seen their stock prices return to tech boom levels.
2 comments:
It looks like the author for some reason used nominal values. But there are other things left out that skew the numbers the other way. Since housing generally has near-zero appreciation, they shouldn't generate positive returns until well after the housing costs (with mortgage principal and interest fixed nominally) become less than the corresponding rental costs.
The rate of return should be calculated based on the 60,000 investment. I think your rate of return percentages may lead you to a different conclusion.
Post a Comment